Today, it is possible to calculate an approximation of the luminous intensity distribution of a luminaire based on geometry and material characteristics of the luminaire’s optical system using a computer simulation, or to measure it using the actual luminaire in a suitable laboratory setup. The TRILUX laboratory uses a goniophotometer with a rotating mirror (figure) according to EN 13032-1 "Light and lighting – Measurement and presentation of photometric data of lamps and luminaires – Part 1: Measurement and file format" for this purpose.
Luminous intensity distribution curve
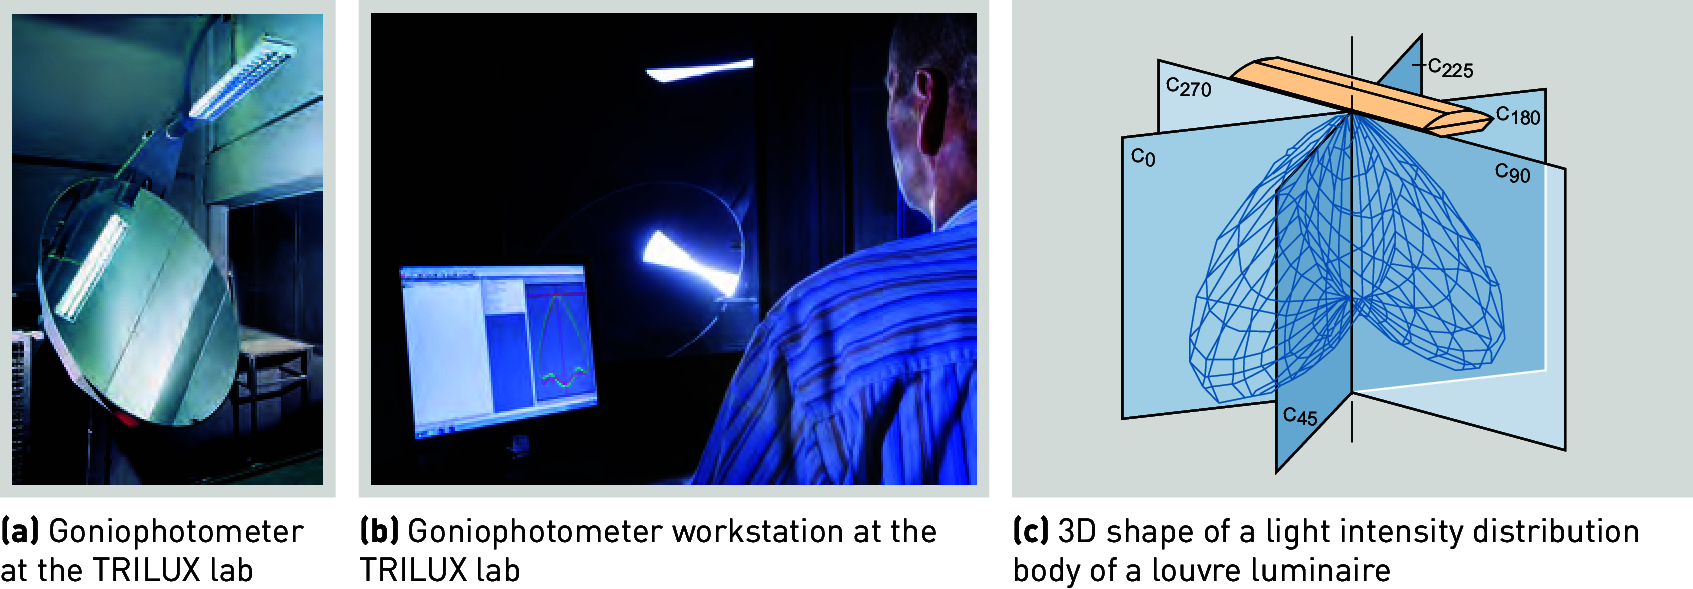
Figure 3.162: Luminous intensity distribution measurement at a goniophotometer with rotating mirror
In practice, a simulation of the luminaire is usually used for development purposes today. At TRILUX, the result of the simulation is additionally verified before any series launch as a principle, using a measurement taken from a prototype based on the simulation using the goniophotometer.
The application of the aforementioned standard to simulations and measurements leads to a depiction of the luminous intensity distribution in a data format defined by EN 13032-1. In addition, they are converted to internationally prevalent lighting design data formats such as e.g. IES. This ensures that the resulting data can be utilised world-wide (see also chapter , "Technical catalogue specifications"). In Europe, the slightly more compact data format EULUMDAT (see also https://en.wikipedia.org/wiki/EULUMDAT), to which measurement data at TRILUX is also converted, is more common in practice.
The spatial distribution of a luminaires luminous intensity is referred to as a luminous intensity distribution model (figure c). Sections through its vertical axis constitute luminous intensity distribution curves in the so-called C levels which are usually documented in polar coordinates. They represent luminous intensity values in standard operating conditions for the luminaire (e.g. normal position, ambient temperature 25°C). They are based on 1,000 lumens of the light sources used in the luminaire and specified in cd/klm (candela per kilolumen) as standard luminous intensity distribution curves.
Luminaires are classified as narrow-distribution, wide-distribution, symmetric distribution, asymmetric-distribution, direct-distribution, direct-indirect distribution and indirect-distribution according to the shape and symmetry properties of their luminous intensity distribution (figure and figure ). A further distinction can be made based on the luminous flux portion directed towards the upper/lower half-space, e.g. as in table.
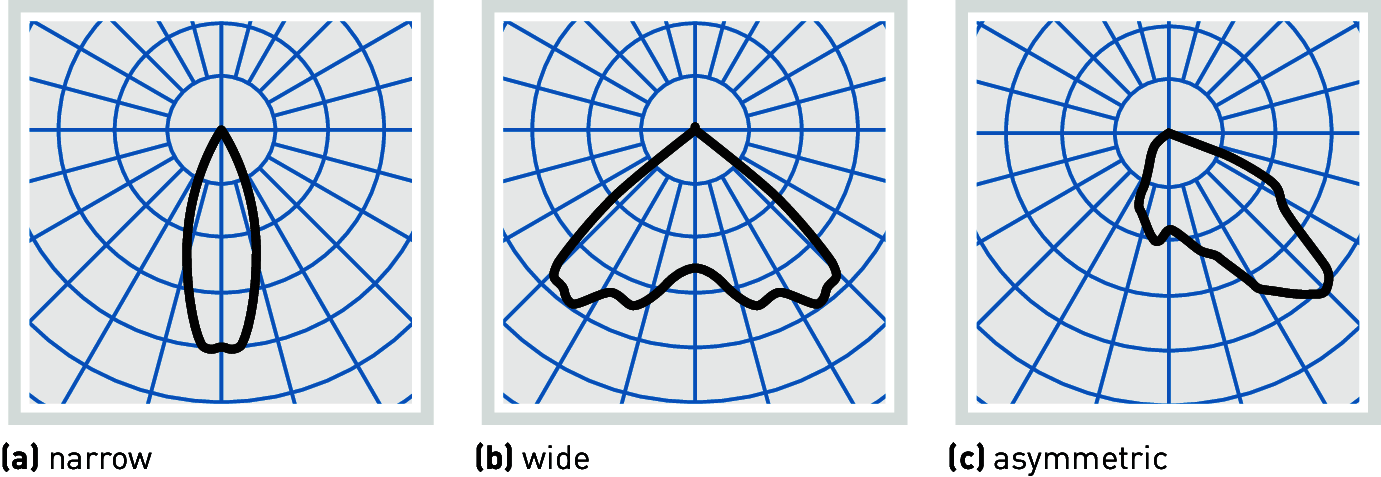
Figure 3.163: Luminous intensity distribution curves of direct-distribution luminaires
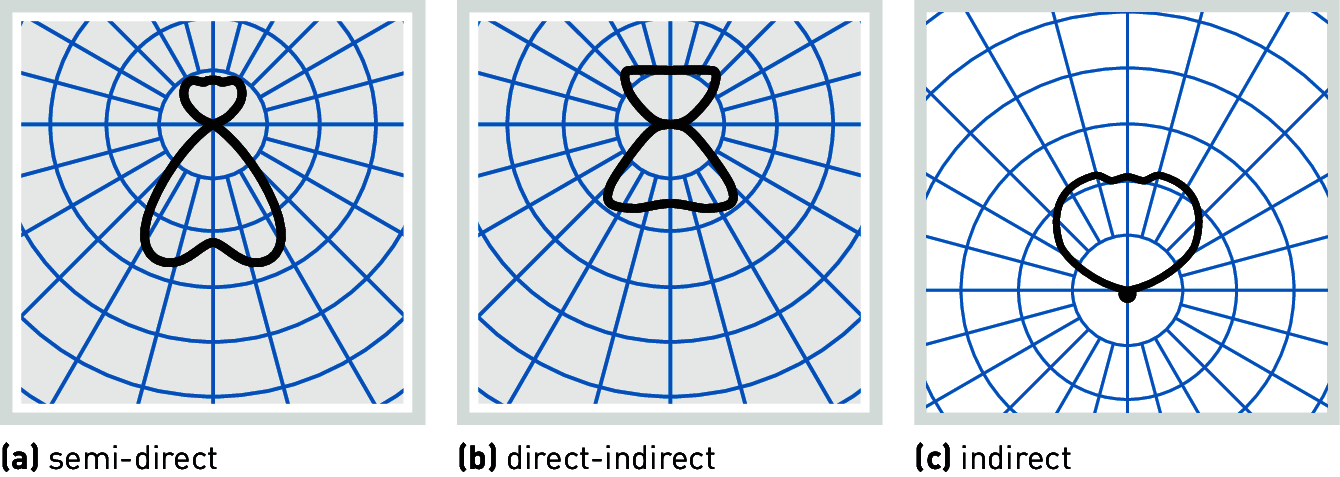
Figure 3.164: Luminous intensity distribution curves with indirect portion
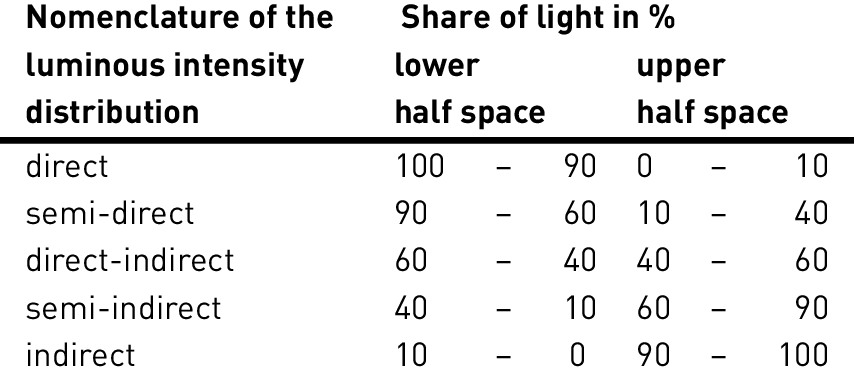
Table 3.133: Identification of luminaires’ luminous intensity distribution according to luminous flux portions
Detailed classifications are made within the definitions of the efficiency method (see subsequent chapter ff). They all refer to the relative luminous flux portions emitted over predetermined solid angle ranges, but still differ in terms of the concrete specifications for this classification.
TRILUX provides luminous intensity distribution curves by means of graphs in the online catalogue, on the luminaire data sheet and in printed product descriptions. They allow for experts to gain a quick quality impression of the luminaire’s photometric effect.
For some modern luminaires, the description as a point light source by means of specifying only one summary luminous intensity distribution is not productive when it comes to describing its photometric effect. This is the case e.g. when luminaires with several, possibly asymmetric light emission points for work zone based applications are located close to the visual task area. In such cases, the simplified method of describing the luminaire as a point light source (distant field observation, see above) can lead to erroneous conclusions. Luminaires with several light sources which can be dimmed separately can also possibly be better expressed through several superposed luminous intensity distributions (see also chapter "Photometric design software DIALux and Relux"). Luminaires of this kind are increasingly available on the market thanks to the use of LED light sources and facilitate the consideration of further aspects of spatial light effects beyond their mere utilization factor.