Noise of identical sound pressure is not perceived as identically unpleasant, which is to say: noise of identical sound pressure can be perceived at varying levels of annoyance. The subjective perception of disruption depends on the frequency distribution of the noise. High frequencies are usually perceived to be more disruptive than low frequencies. Noise with "sound pressure peaks" in narrow frequency ranges are also unpleasant in nature. Particularly metal devices such as luminaires can generate such sound pressure peaks through resonance with incorporated or outside components. Therefore, acoustic inspection of luminaires is necessary right from the point of product development.
NR curve
Psychological noise evaluation is carried out on the basis of NR curves (noise rating curves) according to ISO TC 43 Recommendation 1996 “Assessment of noise with respect to community response”. NR curves of identical annoyance are attributed numerical values equivalent to the level in dB at 1,000 Hz.
This requires the measurement of octave sound pressure levels – i.e. sound pressure at mid-octave frequencies of 62.5 Hz,
125 Hz, 250 Hz, 500 Hz, 1, 2, 4, 8 and 16 kHz as the case may be – which are then entered into an NR diagram. The value of the NR threshold curve just above the octave sound pressure spectrum is the noise rating number. The individual noise rating (NR) curves are marked with digits along the 1,000 Hz line.
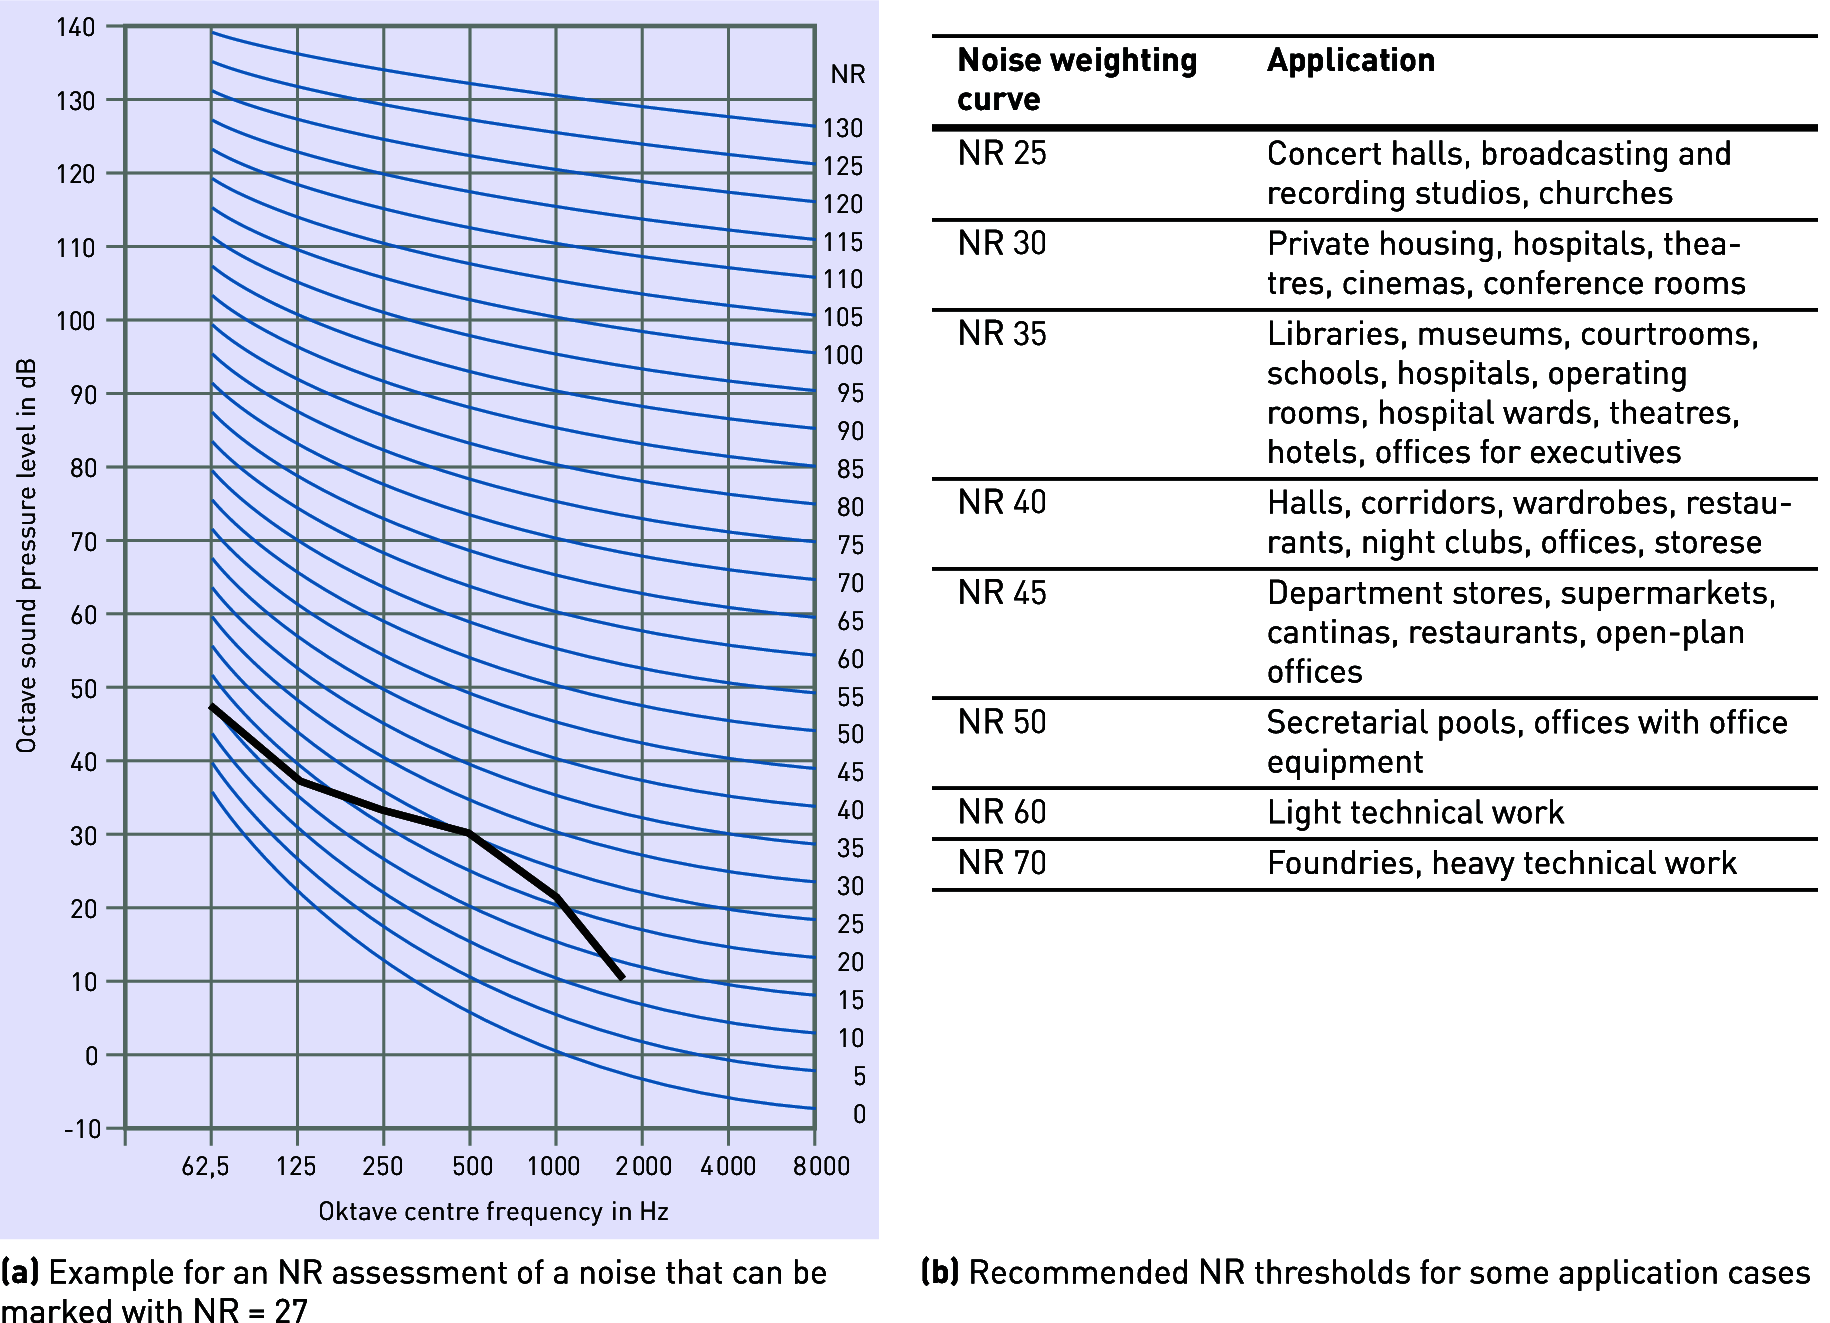
Figure 3.212: NR rating